
Use Chrome DevTools Like a Senior Frontend Developer
11 tips you must know if you choose Chrome as your development environment.
Okay, now for some reason, you’ve finally chosen Chrome as the browser you’re developing for. Then you open Developer Tools and start debugging your code.


You sometimes open the Console panel to examine the output of your program, or the Elements panel to check the CSS code for DOM Elements.

But do you really understand Chrome DevTools? In fact, it provides many powerful but unknown functions, which can greatly improve the efficiency of our development.
Here I’ll introduce the most useful features, hoping to help you.
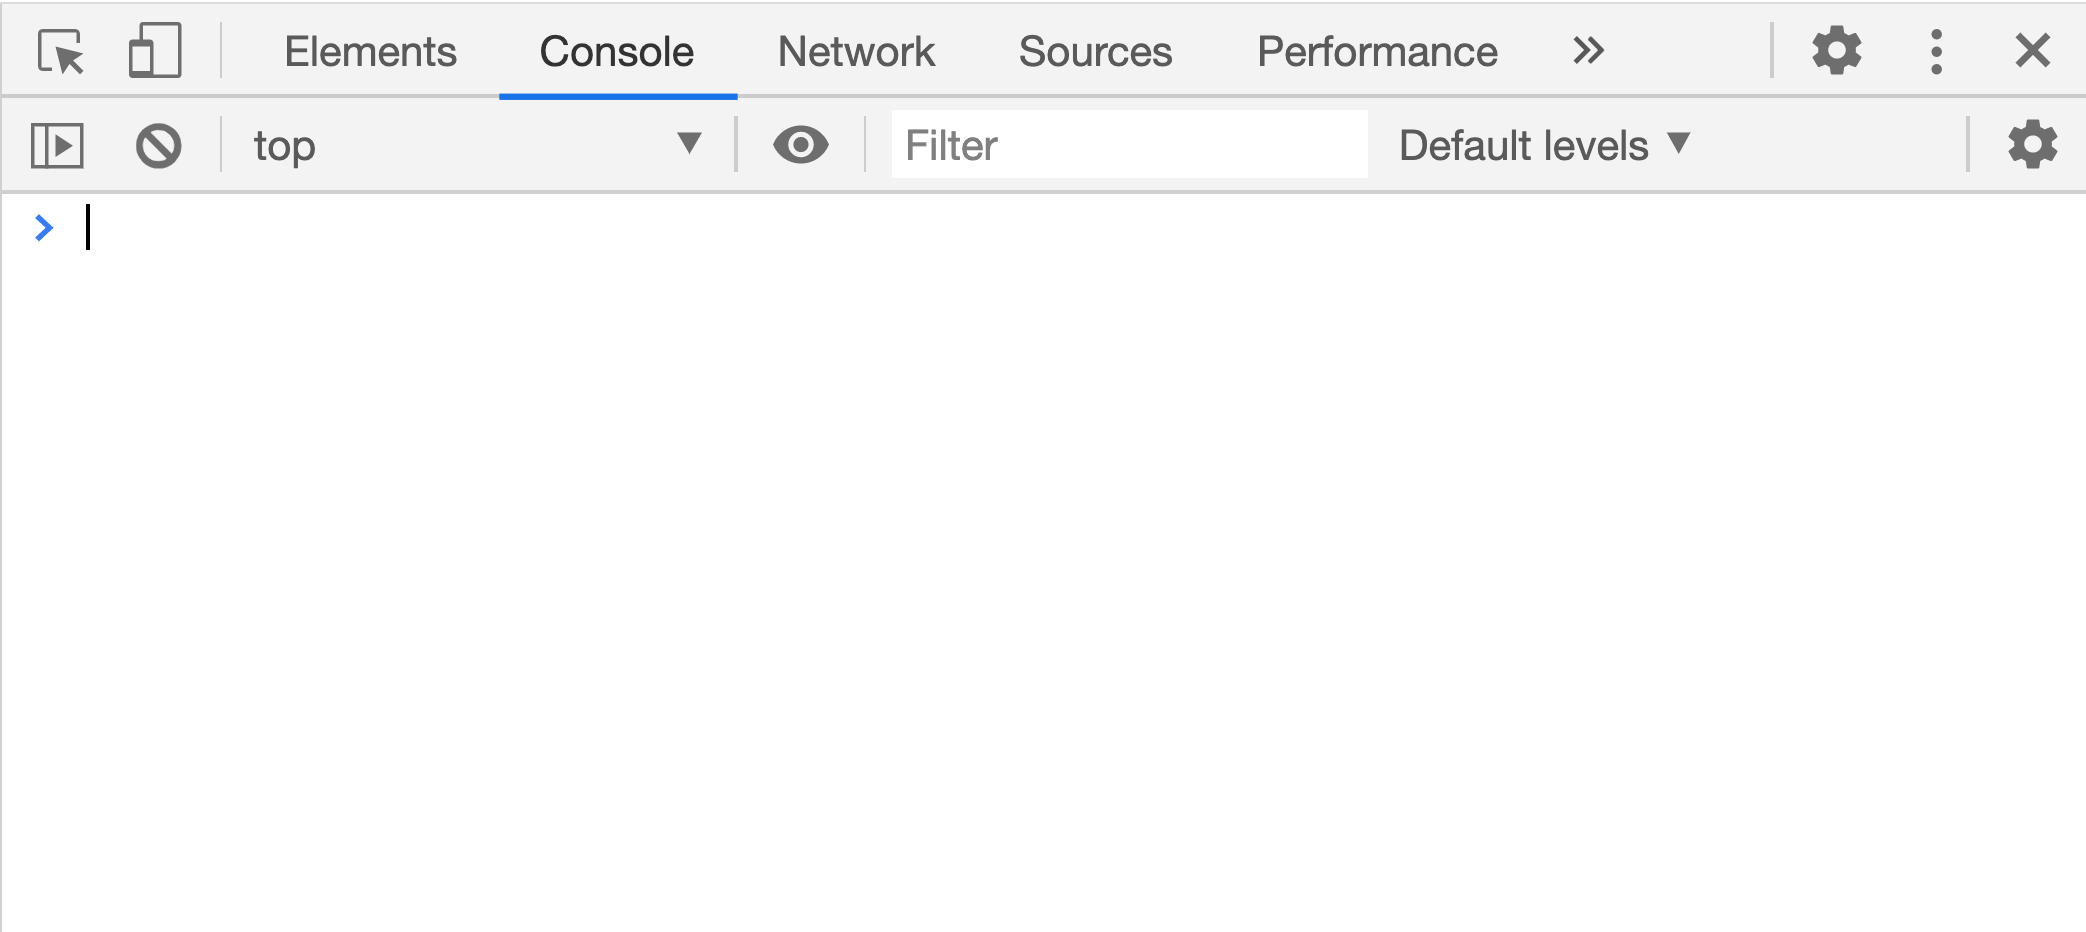
Before we get started, I’d like to introduce the Command menu. The Command menu is to Chrome what the Shell is to the Linux. The Command menu allows you to type in a few commands to manipulate Chrome.
First, we open Chrome Developer Tools, then we open the Command menu with the following shortcut:
- windows:Ctrl + Shift + P
- macOS:Cmd + Shift + P
Or we can just click the button below to open it:

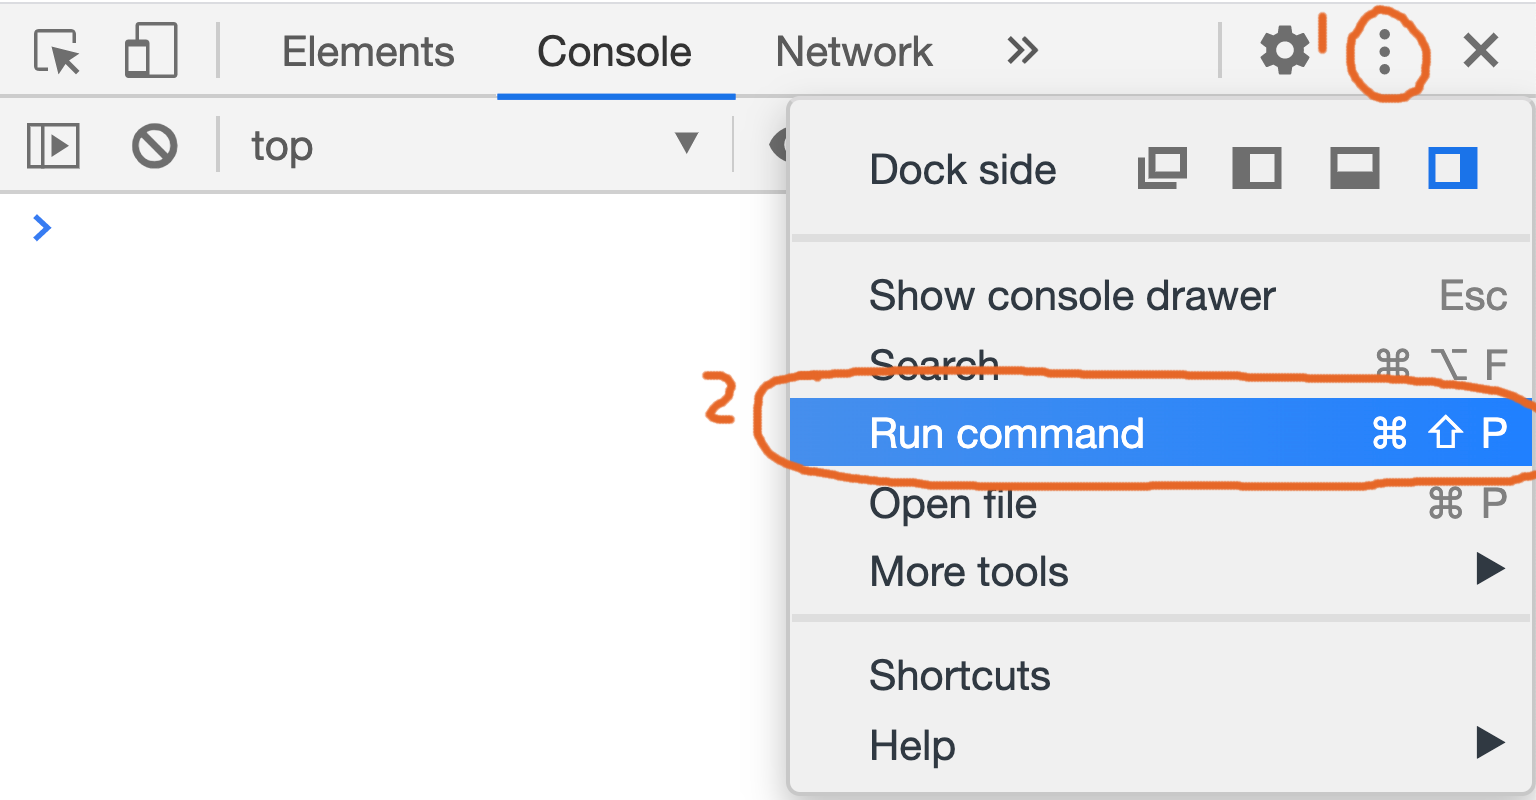
Then we can go to the Command panel, where we have a variety of commands to choose from to perform various powerful functions.

Powerful screenshots
Capturing a part of a screen is a very common requirement, and I’m sure you already have very convenient screenshot software on your current computer. But, can you complete the following tasks?
- Take a screenshot of everything on a web page, including anything that doesn’t appear in the visual window
- Capture exactly the content of a DOM element
These are two common requirements, but they are not easily addressed using the screenshot tools that come with the operating system. At this point, we can use the Commands to help us complete this requirement.
The corresponding commands are:
- Screenshot Capture full size screenshot
- Screenshot Capture node screenshot
Example
Now open any web page, for example, the top stories page for JavaScript on Medium. https://medium.com/tag/javascript
And open the Command menu and execute Screenshot Capture full size screenshot

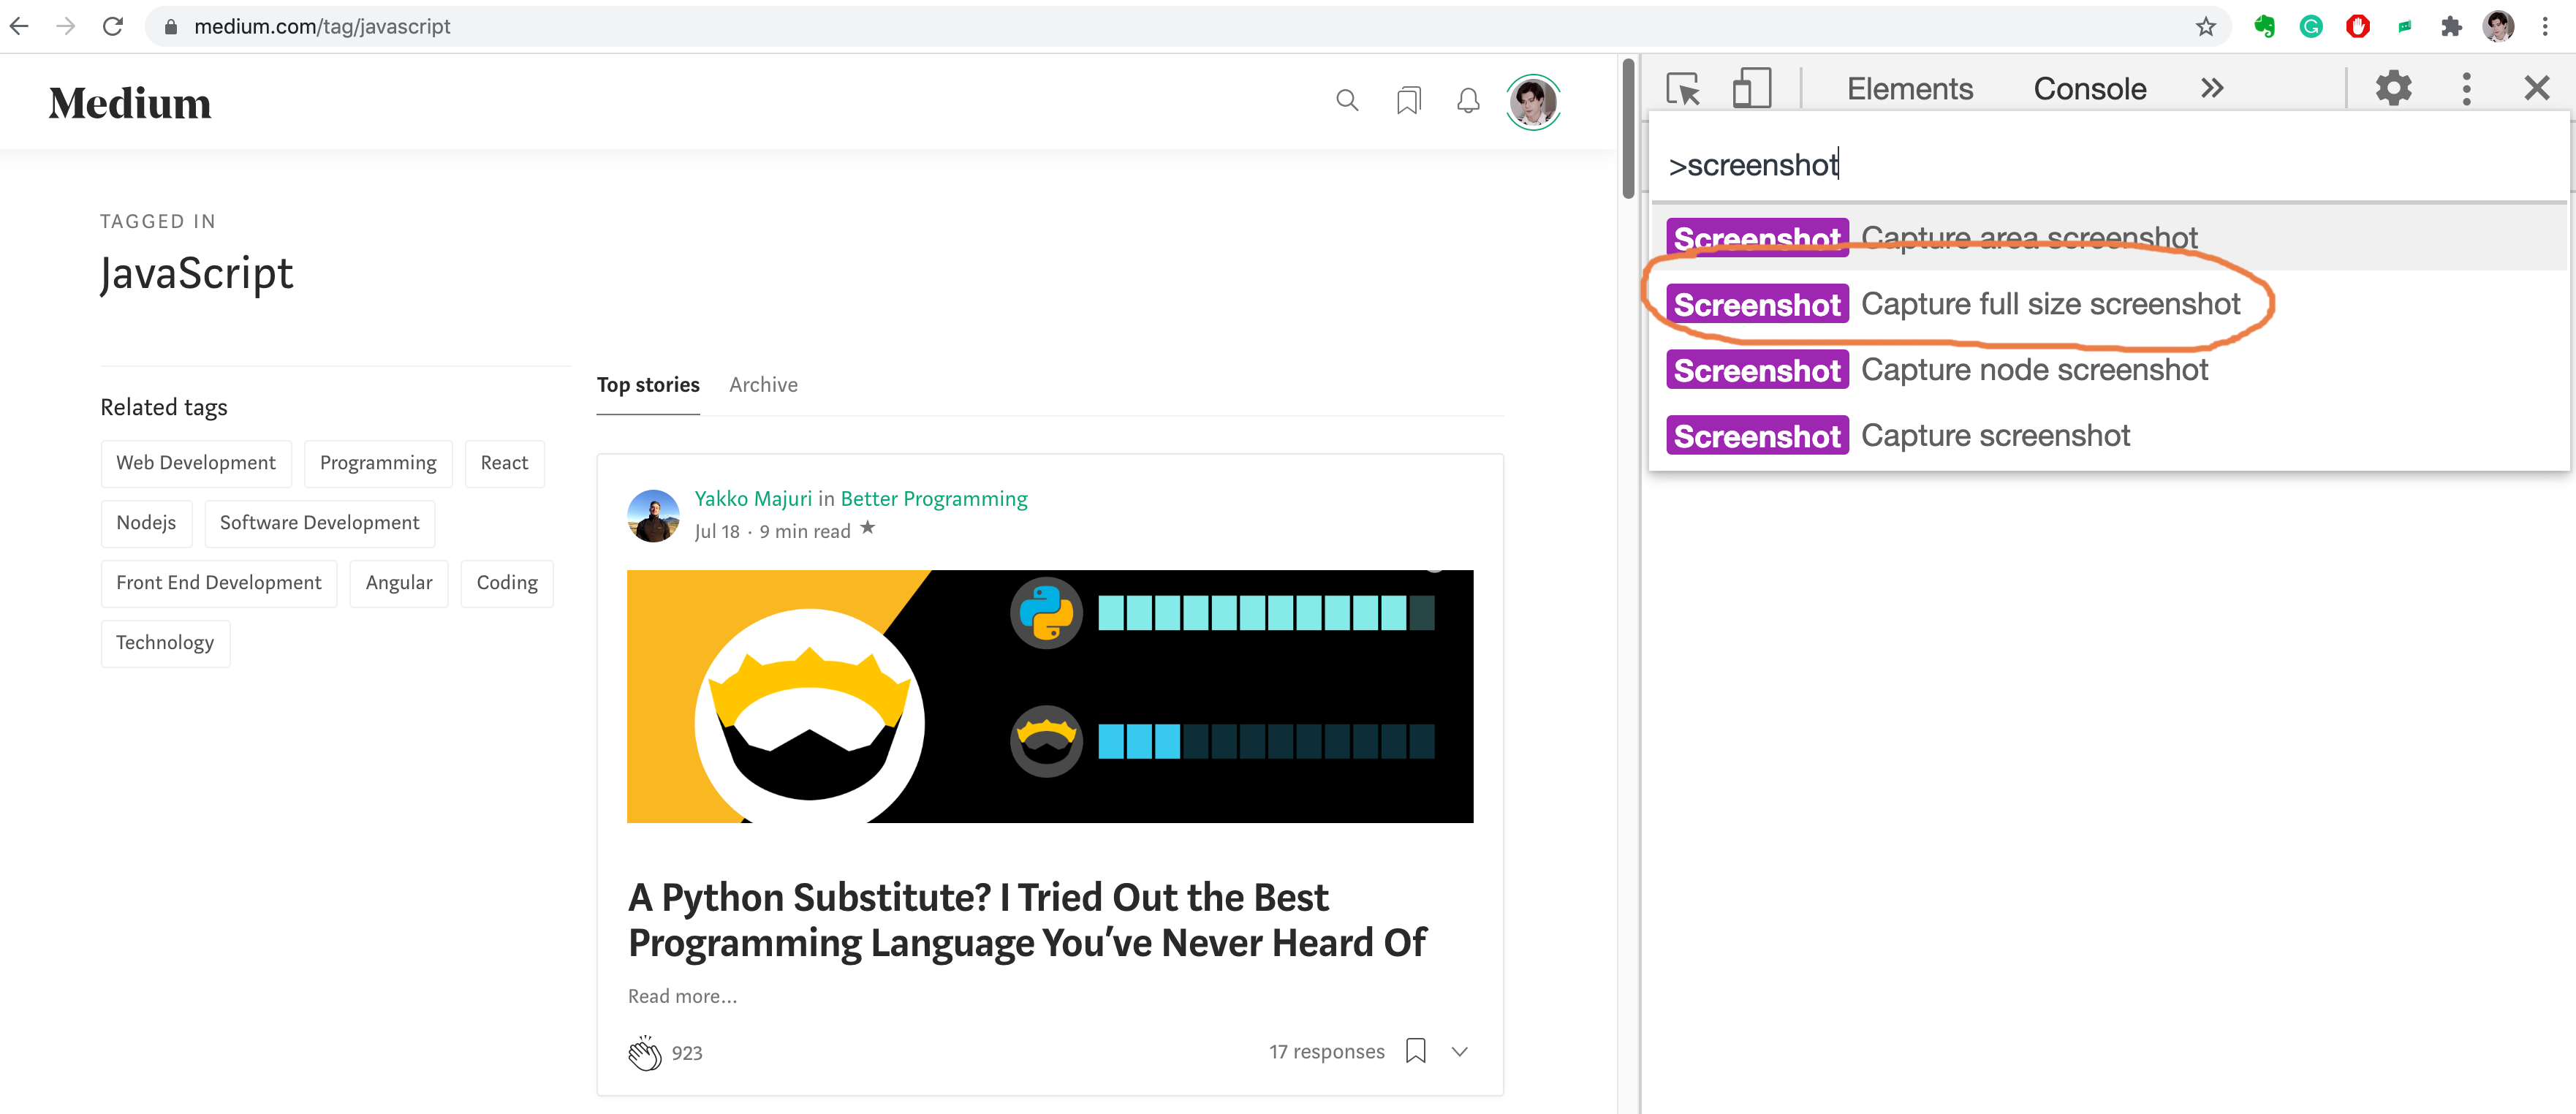
Then we can get a full screenshot of the current page.


The original image above is very clear, but here I uploaded a compressed image to save your traffic.
Similarly, if you want to take a screenshot of a DOM element, you can use the system’s own screenshot tool, but you can’t capture the element exactly. At this point, you can use the Capture node screenshot.
First, we select an element in the Elements panel and then run the command.

This is the result of the exact screenshot:

Reference the result of the last operation in the console
We often need to debug code in the console. Suppose you want to know how to reverse a string in JavaScript, and then you search the web for relevant information and find the following line of code.
'abcde'.split('').reverse().join('')
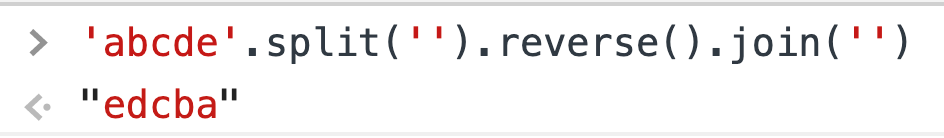
Well, the above code does reverse the string. But you still don’t understand what the split() reverse() join() methods do and the results of running these intermediate steps. So now you want to execute the above code step by step, you might write something like this:


Well, after these steps, we do know the return value of each method run.
But this is very redundant. It is both error-prone and difficult to understand. Actually, in the Console, we can use the magic variable $_ to reference the result of the previous operation.

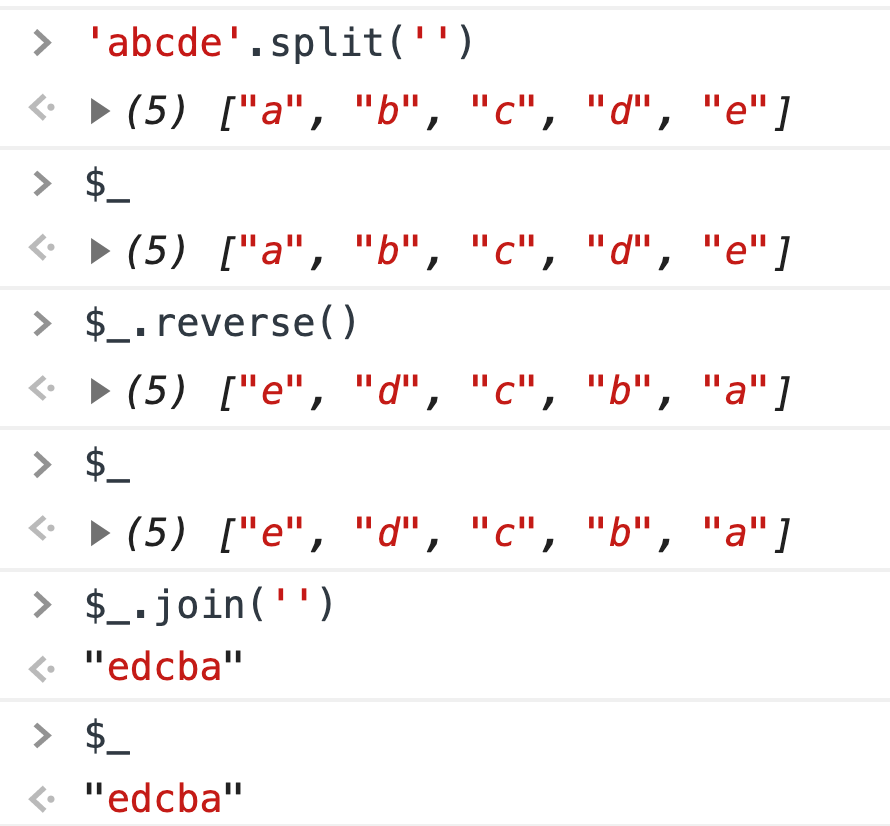
$_ is a special variable whose value is always equal to the result of the last operation in the console. This technique is a handy way to debug your code.


Resend the XHR request
In our front-end projects, we often need to use XHR to make a request to the back-end to get data. What would you do if you wanted to resend an XHR request?
For a novice, he might refresh the page, but this can be cumbersome. In fact, we can directly debug in the Network panel.


- Open Network panel
- Click XHR button
- Choose the XHR request that you want to resend
- Replay XHR
Here is a gif example:


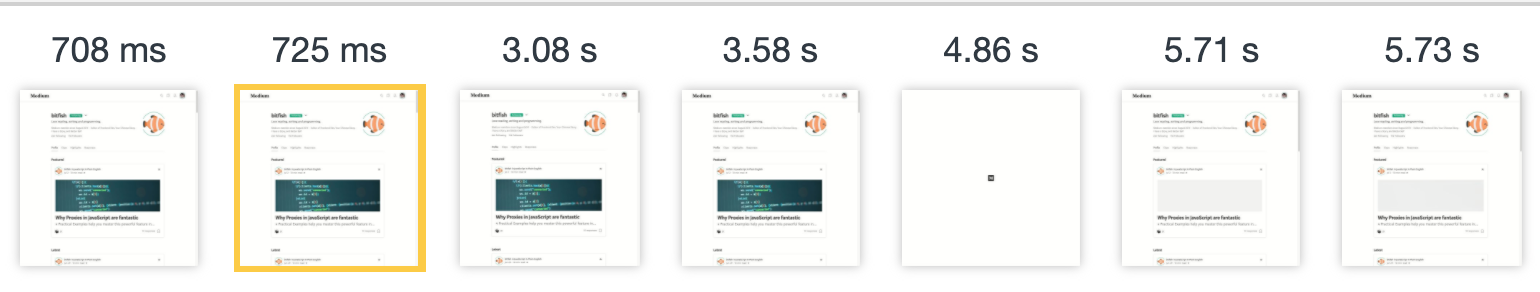
Monitor page load status
It may take more than ten seconds for the page to load completely from the start. This is where we need to monitor how the page loads at different times.
In Chrome DevTools, we can capture screenshots of the page loading using Capture Screenshots under the Network panel.

Click on each screenshot to show the network request at the corresponding time. This visual presentation will give you a better idea of what network requests are happening at every moment.

Copy Variables
Can you copy the value of a JavaScript variable somewhere else?
This may seem like an impossible task, but in Chrome, there’s a function called copy that helps you copy a variable.

The copy function is not defined by ECMAScript but is provided by Chrome. With this function, you can copy the value of a JavaScript variable to your clipboard.
Copy the image as the data URI
There are two ways to process the images on our page, one is to load them by external resource links, and the other is to encode the images into data URLs.
Data URLs, URLs prefixed with the
data:scheme, allow content creators to embed small files inline in documents. They were formerly known as "data URIs" until that name was retired by the WHATWG.
Coding those small images into Data URLs and embedding them directly into our code reduces the number of HTTP requests our pages need to make, thereby speeding up pages load.
So in Chrome, how do we turn an image into a data URL?
Here is a gif:

Table object array
Suppose we have an array of objects like this:
let users = [{name: 'Jon', age: 22},
  {name: 'bitfish', age: 30},
  {name: 'Alice', age: 33}]
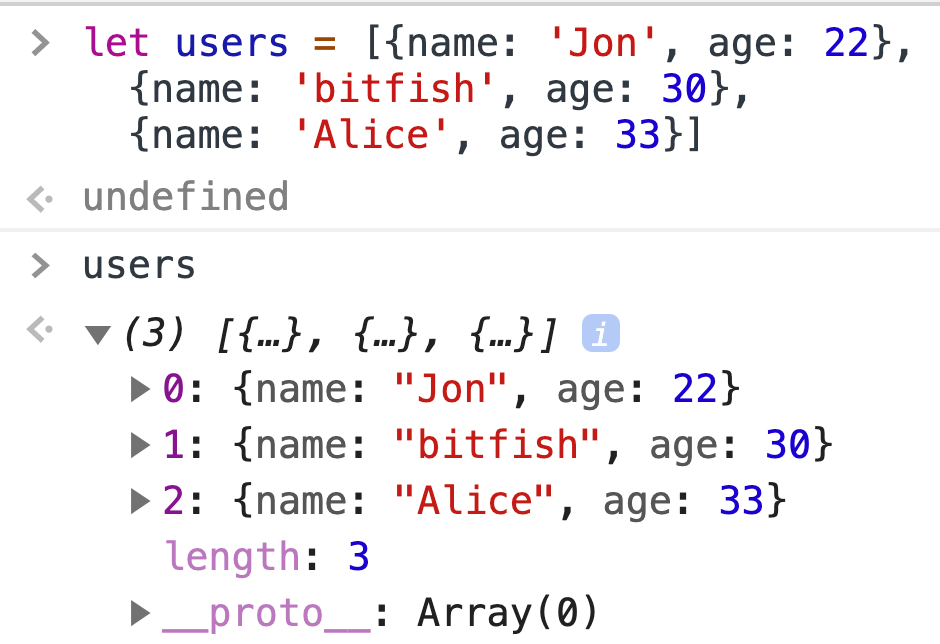
Such an array is not easy to view in the console. If the array is longer and the elements are more complex, then it becomes even harder to understand.
Fortunately, Chrome provides a table function that tabulates an array of objects.


In many cases, this function is very useful.
Drag and Drop in the Elements panel
Sometimes we want to adjust the location of certain DOM elements on the page to test the UI. In the Elements panel you can drag and drop any HTML element and change its position across the page:

In git above, I dragged the location of a div in the Element panel, and its location on the web page was changed synchronously.
Reference the currently selected element in the Console
$0 is another magic variable that references the currently selected element in the Element panel.

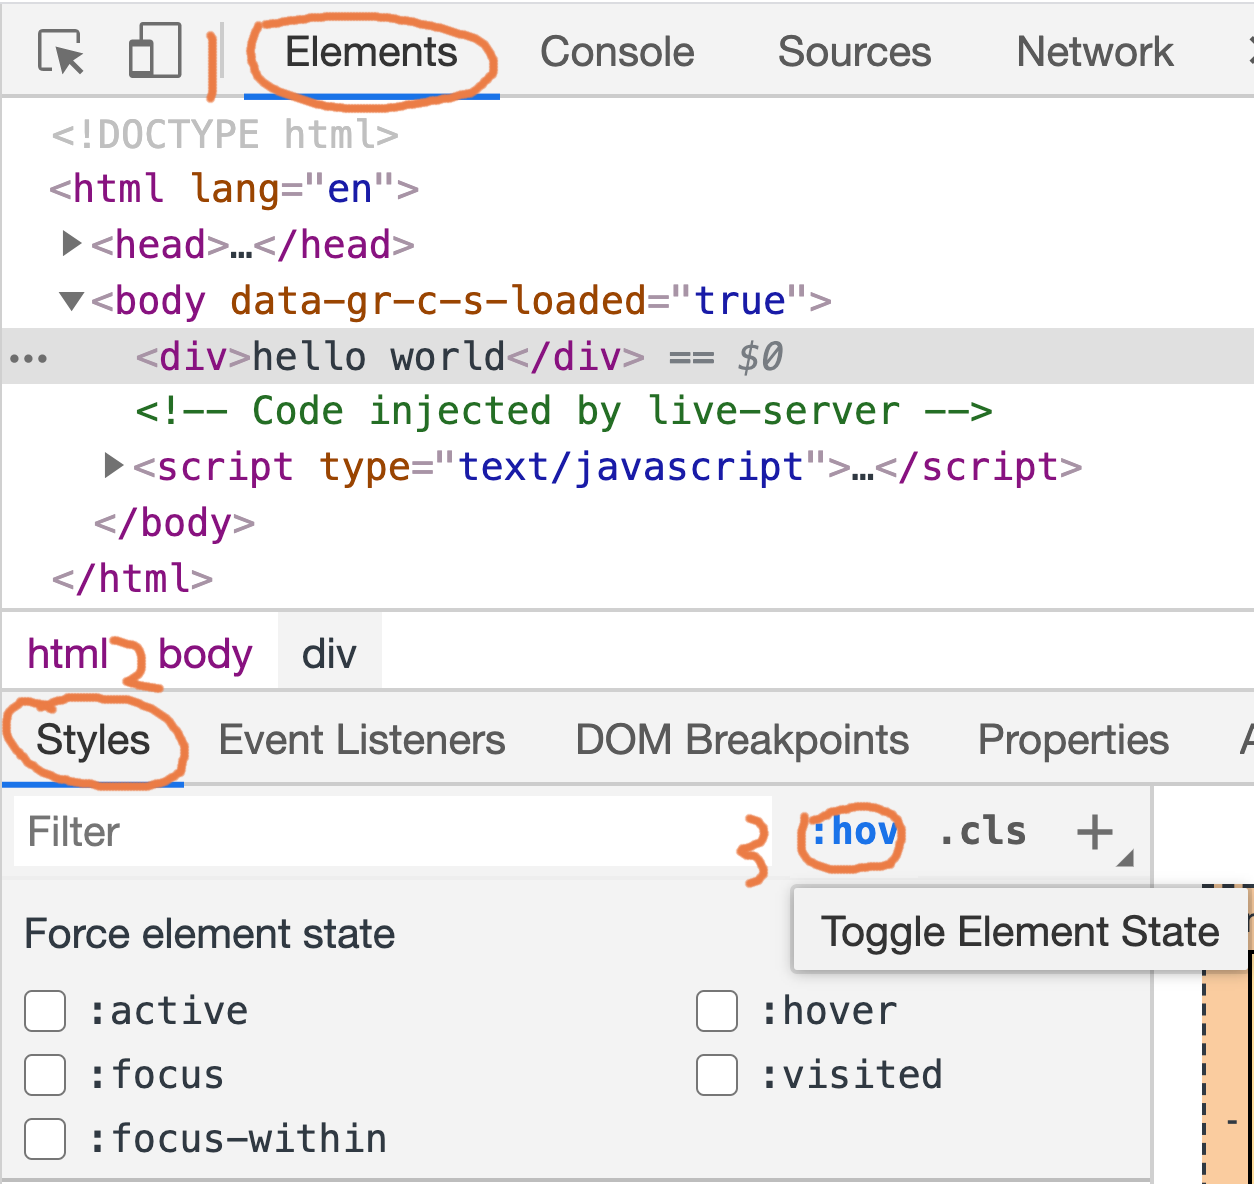
Trigger CSS pseudo-class
Pseudo-classes let you apply a style to an element not only in relation to the content of the document tree, but also in relation to external factors like the history of the navigator (
:visited, for example), the status of its content (like:checkedon certain form elements), or the position of the mouse (like:hover, which lets you know if the mouse is over an element or not).
We might write multiple pseudo-classes for one element, and to facilitate our testing of these styles, we can trigger these styles directly in the Elements panel.

Example
Here is a webpage:
We then open it in a browser and debug its pseudo-class style through the Elements panel.

Shortcut to hide an element
When debugging CSS styles, we often need to hide an element. If we select the element and press H on the keyboard, we can quickly hide the element.


This operation is to add an visibility: hidden !important; style to the corresponding element.
Store a DOM element in a global temporary variable
If we want to quickly get a DOM element reference in the Console, we can do this:
- select the Element
- right-click the mouse
- Store as a global variable

Nguồn: Medium


Post a Comment